Why Texas Royalty Brokers?

sellers
Buyers

State Specific Guides
Resources

Decline Curves Explained: A Guide for Mineral Owners
Decline curves are one of the most important concepts in oil and gas, but also one of the least understood by mineral owners.
A decline curve shows how oil and gas production from a well naturally falls over time. At first, new wells generate strong royalty checks, but those high numbers almost always come down quickly as production drops.
For mineral owners, understanding decline curves is essential. They explain why royalty income changes from month to month and also play a major role in how buyers calculate what your minerals are worth.
In this guide, we will break down what decline curves are, why they matter, and how they impact your decisions around keeping or selling mineral rights.
What Are Oil and Gas Decline Curves?
A decline curve is a simple but powerful tool used to predict how oil and gas production from a well will change over time. Every well starts strong, with high production rates in the early months, but output naturally falls as pressure in the reservoir declines.
A decline curve takes that pattern and puts it into a visual chart so you can see how production is expected to drop.
For mineral owners, this is one of the most important concepts to understand. Decline curves explain why your royalty checks might look impressive at first but then shrink month after month. They also help illustrate why a mineral buyer values your minerals based on long-term production potential, not just the short-term income you may be seeing today.
Below is an example decline curve showing how production starts high and then steadily decreases over time. This type of chart is the foundation for evaluating royalty income and mineral rights value.
When you look at a decline curve, the steep drop in the beginning stands out. This is the early flush production, when wells are strongest and royalty income is at its peak.
Over time the curve flattens, showing that production never stops completely, but it slows to a much lower and more stable rate.
Understanding this pattern is critical for mineral owners. The early months may bring large checks, but buyers know those checks will not last. They rely on decline curves to forecast future cash flow and determine what they are willing to pay for your minerals.
Why Decline Curves Matter in Oil and Gas
Decline curves are more than just charts. They are one of the primary tools used by engineers, operators, and buyers to understand the long-term value of a well. Without them, it would be impossible to make accurate decisions about drilling, production forecasts, or mineral valuations.
For mineral owners, the importance of decline curves comes down to three main points:
-
Predicting future royalty income: Decline curves show how quickly production will drop and what income you can realistically expect over the years ahead.
-
Determining fair offers: Buyers use decline curves to calculate the present value of your minerals. A well with a steep decline will bring in less income over time, which lowers the offer, even if your checks are currently high.
-
Making better timing decisions: Knowing how production will change helps mineral owners decide when to sell or hold. The early months can look attractive, but they are often misleading without understanding the decline that follows.
In short, decline curves matter because they separate short-term excitement from long-term reality. They reveal the true economic life of a well and provide the framework for how much your minerals are worth today.

How Decline Curves Impact Royalty Income
For mineral owners, the most direct impact of decline curves is seen in your royalty checks. When a new well comes online, the first few months often bring the largest payments you will ever receive. This happens because production is at its highest and the operator is selling the most oil and gas.
As the decline curve shows, production quickly begins to fall. Royalty checks that looked substantial in the early months can shrink by half or more within the first year. Over time, the decline slows, but the checks settle at a much lower level than what you initially experienced.
This creates two key realities for mineral owners:
-
High early income is temporary. The steepest part of the decline happens in the beginning, so your checks will naturally drop even if the operator continues producing.
-
Long-term value depends on the curve. Buyers are not looking only at your current check. They are discounting future income based on how quickly the curve shows production will fall.
The bottom line is that decline curves explain why your income changes so dramatically after a new well is drilled and why the long-term value of your minerals may be different from what your short-term income suggests.
The Role of Fracking in Oil and Gas Decline Curves
Hydraulic fracturing, or fracking, has changed the shape of decline curves in modern oil and gas wells. By breaking open rock formations and releasing trapped hydrocarbons, fracking allows operators to bring a large volume of oil and gas to the surface very quickly.
For mineral owners, this has two major effects:
-
Steeper initial declines: Fracked wells often produce a surge of oil and gas in the first months, but that production falls sharply as the reservoir pressure drops. The early royalty checks can be significant, but they usually do not last long.
-
Longer tails: Even after the steep drop, fracked wells tend to level off and produce at a lower but steady rate for many years. This creates a long tail of income, though much smaller than the initial flush.
When you see a decline curve for a fracked well, you will notice a steep downward slope at the beginning, followed by a flattening line. This pattern is different from older conventional wells, which often had slower, steadier declines.
Fracking makes it more important than ever for mineral owners to understand decline curves. Without this knowledge, the high income in the early months can create unrealistic expectations about what the future will look like.

What Is Flush Production?
Flush production refers to the early stage of a well’s life, usually the first four to five years, when output is at its highest. During this period, oil and gas flow at strong rates, but production also declines rapidly. For mineral owners, flush production explains why royalty checks start off large but then shrink quickly as the well moves past its initial surge.
Oil and Gas Decline Curve Tool: Visualizing Single-Well Production
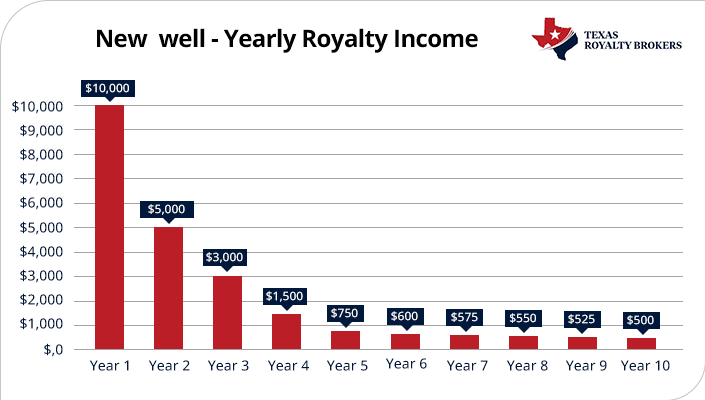
The decline curve tool below illustrates how oil and gas production from a single well typically changes over time. Production generally starts at a higher level and then declines as reservoir pressure decreases and recoverable hydrocarbons are produced.
This tool is designed to provide a practical visual reference for how future royalty income may trend under a standard decline scenario. It helps explain why early royalty checks are often higher and why long-term income typically settles at lower levels as a well matures.
It is important to understand that most mineral owners receive royalty income from multiple wells, often drilled at different times and producing at different rates. Actual mineral income is usually the result of several overlapping decline curves rather than a single production profile.
Use this decline curve tool to better understand production behavior over time. For an accurate estimate of mineral rights value, decline curves should be evaluated across all wells and combined with factors such as well age, operator development plans, and future drilling potential.
What the chart shows
-
Very high early income with a steep drop in the first few years
-
By year 10 the annual income is only a small fraction of year 1
Even if we adjust the assumptions slightly, the outcome is always the same. Roughly 66% to 75% of all the money a well will ever make comes in the very beginning. The long tail can last decades, but the income is relatively small compared to what happens in the flush years.
This is where many mineral owners run into frustration.
They see the first royalty checks and expect that level of income to continue for years, even decades. But buyers know the reality. They use decline curves to project future cash flow, and they will never pay based on the assumption that those high early checks will last. The math shows too clearly that the vast majority of value is front-loaded.
For mineral owners, this means the early months can feel deceiving. The checks are real, but they are not sustainable. Understanding decline curves helps set realistic expectations and explains why mineral valuations may be lower than what the first few checks suggest.
Why Selling Before New Production Is Best
At first, it may sound counterintuitive to sell right before new wells come online. However, this is the best time to sell mineral rights.
If you have a rig on location or DUC wells on your acreage, now is the time to sell.
Many mineral owners assume they should wait for production to start so they can show buyers how much money the property is generating. But in reality, the best time to sell is often before the first royalty check arrives.
Here’s why you should sell BEFORE new production:
- Peak value: Buyers know that new wells are about to generate significant income. They are willing to pay a premium based on the strong future cash flow that is just around the corner.
- Tax advantages: Royalty income is taxed at ordinary income rates, which can climb well above 30 percent once state and federal taxes are combined. In contrast, selling minerals is generally treated as a capital gains event. For heirs, there can also be a step-up in basis, which further reduces or even eliminates taxes owed.
- Avoiding the decline trap: Once flush production begins, royalty checks look impressive, but they drop quickly. Buyers adjust their offers accordingly, which means the minerals can be worth less after new wells are drilled than they were before.
This is the piece many mineral owners overlook.
They hold onto their minerals through flush production, pay ordinary income tax on the large early checks, and then discover that buyers will only offer a fraction of what they once could have received. By selling before new production starts, you not only capture top dollar but also save a fortune in mineral rights taxes that would otherwise go to the IRS.
In short, selling before new production begins is counterintuitive, but it’s smartest financial move. It locks in maximum value and avoids the tax burden that comes with chasing early royalty checks.
The best time to sell mineral rights is when you have DUC (drilled uncompleted) wells or completed wells on your acreage.
Why Selling After New Production Is Hard
For many mineral owners, the temptation to sell comes right after a new well is drilled. The royalty checks are large, sometimes the biggest they have ever seen, and it feels like the value of the minerals has gone up dramatically.
The problem is that buyers know exactly what the decline curve looks like. They understand that the early income is flush production, and that it will drop off quickly. By the time you decide to sell, buyers have already accounted for the steep decline and will not value your minerals based on those first checks.
This creates a mismatch in expectations:
- Mineral owners see high checks and want a high price.
- Buyers see a steep decline and offer much less.
The result is that selling after new production starts is often difficult or even impossible. Buyers are unwilling to pay for income they know is temporary, while mineral owners feel like they are giving up too much if they accept a lower price.
The decline curve is the reason behind this gap. It explains why new production does not always make selling easier and why realistic expectations are critical for mineral owners.
Key Takeaways for Mineral Owners
Decline curves can feel technical, but the lessons for mineral owners are straightforward.
Wells produce the most in the early years, and that income falls off quickly. Buyers understand this and value minerals based on long-term projections, not just the flush income shown in the first few checks.
- Most of a well’s lifetime income is captured in the first five years
- Flush production creates impressive checks that decline quickly
- Selling after new production begins is difficult because buyers discount the decline
- Selling before new wells are drilled often delivers peak value and better tax treatment
The bottom line: decline curves explain why royalty checks change, why mineral buyers make the offers they do, and why timing matters so much. Understanding these patterns allows mineral owners to make smarter decisions and avoid costly mistakes.
Final Thoughts
Decline curves may seem like an engineering detail, but they carry real consequences for mineral owners. They explain why the first royalty checks are so large, why income falls so quickly, and why buyers often offer less than expected after new wells are drilled.
The key takeaway is timing.
Most of the value comes in the flush years, yet that income is taxed at ordinary rates. Selling before production begins often unlocks the highest value and offers better tax treatment.
Mineral owners who understand decline curves are better equipped to set realistic expectations, avoid surprises, and make choices that maximize the long-term value of their property.
At Texas Royalty Brokers, we help mineral owners navigate these decisions with clear market insight and a proven sales process. If you are considering selling your minerals or want to understand how decline curves affect your property, reach out to our team.
We can walk you through your options and help you capture the most value at the right time.